Peer benchmarks built around
how your clients work.
NTEE codes sort nonprofits by mission. Bearings sorts them by financial behavior. Seven archetypes, 2,492 organizations, and a distribution curve your client actually belongs in. Built for advisors with a roster, and just as useful if you're sizing up your own organization's numbers.
14 days, real data, three client organizations, no credit card required. See pricing →
Not sure which one fits?
"We supply the distribution. The advisor supplies the diagnosis."
The Financial Forest benchmarking principle
The benchmarks are there.
They just rarely fit.
Two patterns keep coming up in conversations with financial advisors working in the nonprofit sector.
"The comps rarely match. A $12 million community health center ends up benchmarked against a $40 million one just because they share a mission category. I end up building my own peer sets from scratch."
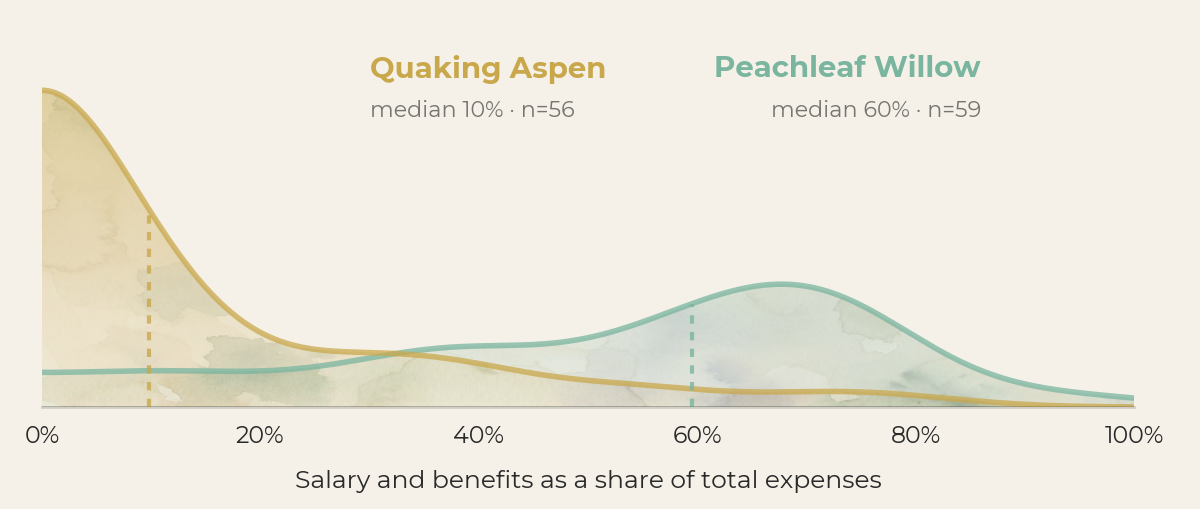
NTEE codes describe what an organization does. They say nothing about how it works financially. In Housing & Shelter alone, one mission code, 139 organizations, we found all seven archetypes represented: one shelter runs on 65% government grants, another on 97% program revenue, another on 95% private contributions. Same code, three different businesses. Every major mission category we've studied splits the same way.
"The tool flagged a Head Start operator as financially stressed for having a lean admin ratio. That ratio is structurally required by the federal funding model. I stopped using automated benchmarking tools after that."
Automated scoring assigns grades without context. A ratio that signals distress in one funding model signals discipline in another. Bearings doesn't score. It shows where your client sits in the distribution, and you bring the context.
The whole tool, in six stops.
The same six places you'll open once you're logged in. Click through to see what each one gets you.
Home
Why archetypes beat mission codes, and a two-minute tour to find your way around.
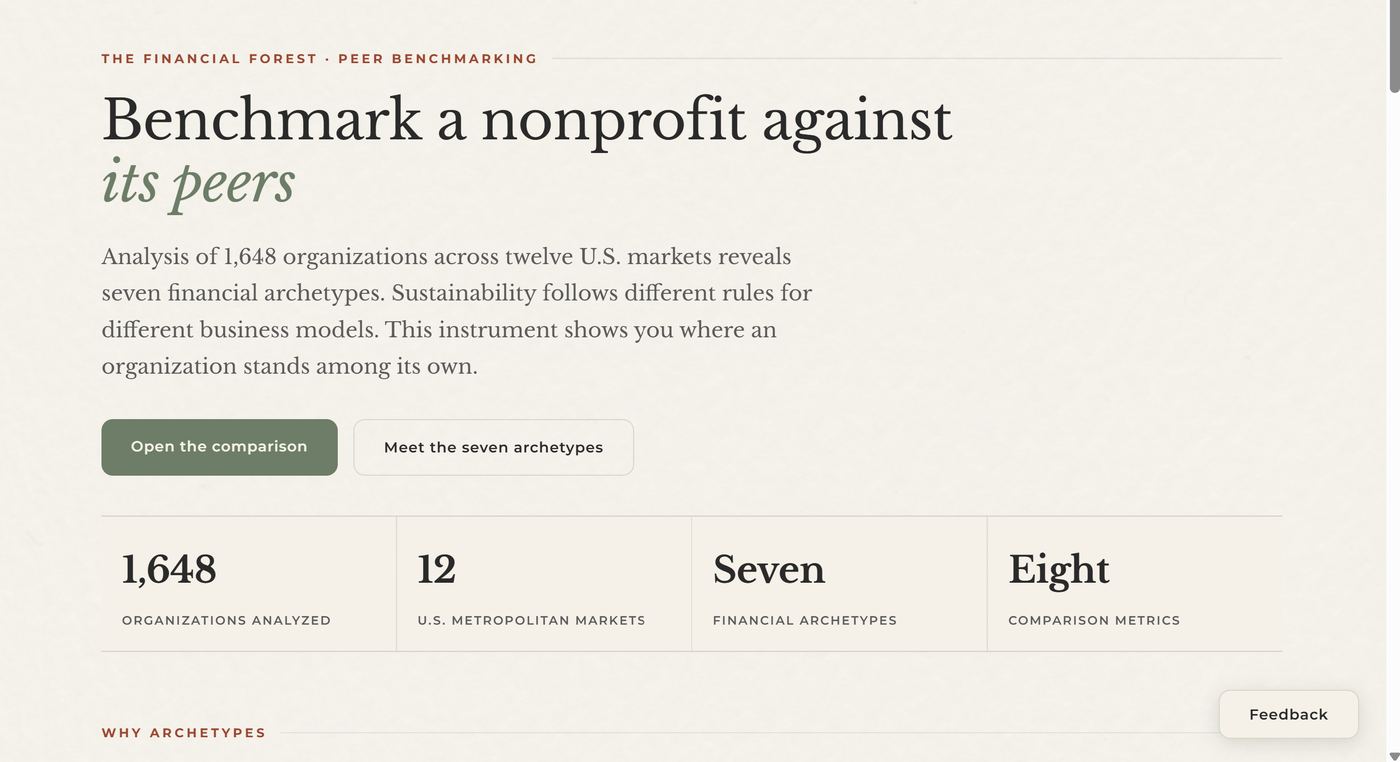
Home is where you land first. It's built to get you oriented fast: the data behind why financial archetypes outperform mission codes, a four-step walkthrough of how the tool fits together, and a two-minute guided tour of the four places you'll actually work. Your saved clients live in Portfolio.
Home
Why archetypes beat mission codes, and a two-minute tour to find your way around.
Home is where you land first. It's built to get you oriented fast: the data behind why financial archetypes outperform mission codes, a four-step walkthrough of how the tool fits together, and a two-minute guided tour of the four places you'll actually work. Your saved clients live in Portfolio.
Home is where you land first. It's built to get you oriented fast: the data behind why financial archetypes outperform mission codes, a four-step walkthrough of how the tool fits together, and a two-minute guided tour of the four places you'll actually work. Your saved clients live in Portfolio.
Research is where you get fluent in how Bearings groups organizations and why: the seven archetypes, the vocabulary, the reasoning behind the clusters. It's context to help you interpret the archetypes. When you need an objective read on which one actually fits a specific client, that's what Classify is for.
Type the eight ratios in directly, or hand Bearings the EIN and let the Workbench pull the raw figures straight from the filing. The extraction that used to eat a spreadsheet afternoon comes back in minutes, so the time goes to the client conversation instead of data entry.
Roughly one organization in four sits close to the line between two archetypes. Classify settles it: a confirmed archetype pulled directly from two years of Form 990 filings, so you walk into the client conversation with a read you can stand behind instead of a judgment call.
A real distribution curve built from hundreds of organizations in the same archetype. You bring the judgment about what the position means. Bearings brings the accurate peer group to judge it against.
Every saved client, sortable by archetype, so you can see at a glance which of your clients share the same financial terrain and which ones are the outliers.

Built from public 990 data. Organized differently.
The underlying data is Form 990 filings. What makes Bearings different is the grouping: a k-means cluster analysis that identifies organizations with similar financial behavior regardless of mission type or geography.
The result is a pre-computed set of decile breakpoints for each archetype. Your client's metrics go in, and you see exactly where they land in the distribution of organizations that actually work like they do.
The archetype framework and benchmarks are proprietary. The raw 990 data they're built from is public.
One limit worth naming: within most archetypes, smaller organizations hold more days of cash than larger ones, a pattern tied to scale rather than financial health. Operating margin and growth compare cleanly regardless of size.
It's a growing dataset, too: new filing years and metro markets are added as they become available.
See the whole distribution.
Bring your own read.
Bearings hands back the full peer distribution: the actual shape of how similar organizations perform on a given metric, so you can see exactly where your client sits inside it.
Whatever language fits the conversation with your client, that judgment is yours. Bearings makes sure the peer group underneath it is accurate, drawn from three years of Form 990 filings across fourteen markets.
You already know how to read a client's financial picture. Bearings makes sure you're reading it against the right neighbors.
Pricing that scales with your client roster.
Classify is a free, classification-only entry point. Starter and up unlock the full tool, scaling with how many active client organizations you keep in your portfolio.
- No active client organizations
- Ratio Workbench and Compare locked
- Credit packs only, no monthly allotment
For anyone who just needs an occasional confirmed archetype, not a full client roster, whether that's one client or your own organization.
- 3 active client organizations
- Full Ratio Workbench
- Peer distribution curves, all archetypes
- 1 credit / month
- 10 active client organizations
- Everything in Starter
- Board-ready branded PDF exports
- 5 credits / month
Most used by boutique fractional CFO practices with recurring client rosters.
- 30 active client organizations
- Everything in Professional
- White-label PDF exports
- 15 credits / month
Classification credits: one credit runs an objective archetype classification for one organization, read directly from its live IRS Form 990 filings. Each plan includes a monthly allotment; a run only spends a credit once it returns a result, so a lookup with no filing on record never costs you anything. Additional credits can be purchased on top of your plan's allotment as one-off packs.
Start with one client.
The 14-day trial includes real archetype data and up to three client organizations. No credit card required to start.
Already have an account? Log in.