Field Notes · Special Edition · September 2026
Four New Ways to Put
the Research to Work
Nicole Segura
|
1,648 organizations
|
12 U.S. metros
|
Special edition
Sep 23
free webinar
with EBCFO
15 min
the Archetype Field Study,
open through November 11
7
archetype workbooks,
one per business model
This is a special edition, ahead of the September newsletter, featuring new opportunities to help you interact with the research directly and apply it in your work. All of them focus on the same core questions: what kind of organization you are financially and how that ought to influence your perspective and goals as a leader.
A reminder: The Financial Forest analyzes three years of IRS Form 990 filings, 2022 through 2024, from 1,648 nonprofits across twelve regional-hub U.S. metros, and sorts them into seven financial archetypes based on how each organization raises and holds money rather than on the mission category it picked at incorporation.
Once organizations are grouped by business model, we see how quickly standard advice falls short. Revenue diversification, probably the most repeated recommendation in this sector, has no significant relationship with revenue growth. This finding invites us to move from the knee-jerk “diversify your revenue” advice and start looking at risk-intelligent revenue engine-building appropriate for your business model. Thefinancialforest.com dives deeper into all seven archetypes and key findings.
Below are four ways to engage with the research and apply it to your work, and they are built from actual workshops, client engagements, and research collaborations.
One hour, free: webinar with EBCFO on September 23
On Wednesday, September 23, from 1:00pm to 2:00pm Mountain, Dan Schmidt of EBCFO Services and I are running a free, one-hour webinar on the archetypes: how to figure out which one describes your organization, which metrics are worth tracking once you know, and how to build internal systems that fit the way your organization actually runs. Dan founded EBCFO in 2009 after years in auditing and consulting, has built accounting systems for a lot of nonprofits, and has served on several nonprofit boards himself. Like me, he balances strategy with a bias for action, and it’s sure to be a fun deep dive. Register here, and if the hour doesn’t fit your schedule, register anyway and you’ll get the recording.
Wednesday, September 23
Cultivating Nonprofit Financial Health: Archetypes, Systems, and Sustainable Growth. One hour, 1:00 to 2:00pm Mountain, free. Register even if you cannot attend live and the recording will come to you.
Save my seat
Fifteen minutes, free: the Archetype Field Study
The archetypes describe how organizations are financially structured. What a tax form cannot tell me is what each of those models demands of the person running it: the skills the model rewards, which funders genuinely fit it, what a board needs to understand to govern it well. As the research expands to capture more qualitative data and go beyond the 990, I’ve created the Archetype Field Study survey, now open at thefinancialforest.com/field-study, taking responses through November 11.
It is built for executive directors, CEOs, finance leads, board chairs, treasurers, and board members who have held that role at a nonprofit for at least one year since 2022. The survey should take about 15 minutes, longer if you want to say more. If you leave your email and your organization files a full 990, you get your classification back within two weeks, along with some insights as to what that group looks like across the dataset. Responses are confidential rather than anonymous, since they get matched to filings, and nothing gets published connected to your name, organization, or even city/state without your explicit permission.
Contribute to the research
The Archetype Field Study takes about fifteen minutes and stays open through November 11. Leave an email and your classification comes back within two weeks.
Start the Field Study
$35: the Archetype Workbook for your model
Each of the seven archetypes now has its own workbook. There is a Reference Sheet laying out the financial engine of the model and how its numbers map back to specific lines on your 990, a Reflection Guide of prompts that move a leadership team from reading about the archetype to reasoning about their own organization inside it, and a Case Study set in a fictional composite organization running on your model, where you watch a familiar misreading unfold and then prepare to act on what you uncover.
One organization needs one workbook, since you run on one financial model. For consultants, fractional CFOs, funders, and board trainers working across many organizations, the full set of seven is $145 and licenses you or your firm to use all of them with your own clients. If you’re curious to see the format, a free primer is available for download.
Archetype Workbooks
Seven workbooks, one per archetype, $35 each. The complete set is $145 and carries a license to use all seven across your own client organizations.
See the seven workbooks

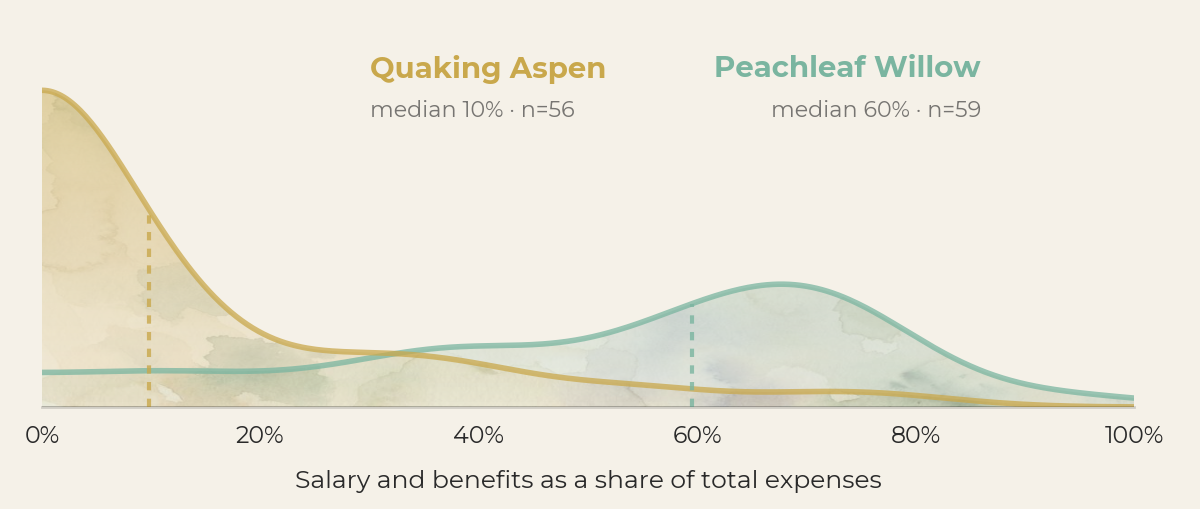
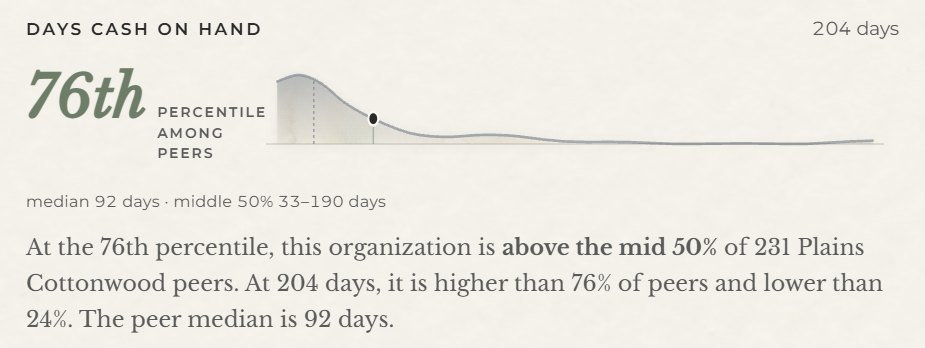
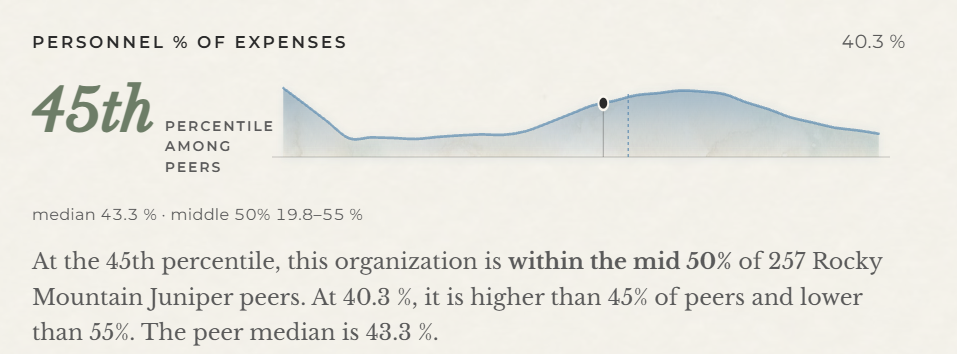
Bearings is where your own numbers go. Eight core financial metrics are calculated, your archetype confirmed from the Form 990, and your figures plotted against the real distribution of your archetype peers: the curve, where you fall on it, the median, and the middle half of the range. No grade, no traffic light, no single number. The research supplies the distribution and the CFO/CPA/advisor supplies the diagnosis from the seat with the context and insight needed to do so. The trial runs 14 days across three organizations with no credit card, and buying any workbook opens a free account and starts that trial.
Bearings
Peer benchmarking by financial behavior rather than mission code. Every account starts with a 14-day free trial of the full tool, no credit card required.
Learn more about Bearings
Two more metros go into the study in October, which widens the geographic base the benchmarks rest on. I’ve confirmed the archetypes have held, and this expansion allows for larger sample sizes as I dive deeper into each archetype group.
The 2025 filing year is coming this winter; the IRS releases 990 data on a long lag, coverage across the organizations I track is sitting right around half, and I expect to fold 2025 into the study by January 2027.
The September newsletter takes a look at stress, which is the part of this research people ask me about most: what actually shows up on a 990 when an organization is under financial strain, and how differently that reads depending on which archetype you are.
Thank you for following and supporting this independent research effort, and I hope to see many of you on the webinar next week!
Get Field Notes in your inbox.
Subscribers receive each issue before it opens in the archive. No pitches, no fluff, just the research.
Follow the Research